Profiling and debugging PHP
Reviewing the code is an important task every programmer must (or should) perform. Sometimes the program you have just coded looks nice and fast, because all the tests you have performed using your well-controlled devel0pment sandbox showed no errors.
Unless you are a god when programming, you may have left some little performance tweaks behind. Most of the time you can replace several method calls with the returned value stored in a variable, or avoiding nested for/whiles, or freeing a result set in order to save some memory, etc. In the end, all those tweaks can make the difference between a smooth user experience and an extremely painful development problem.
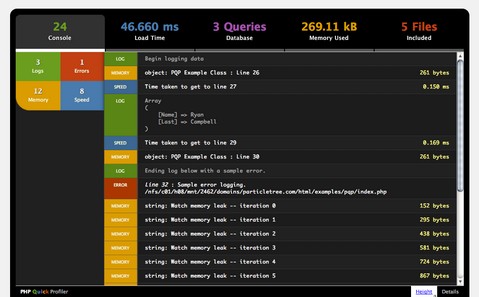
If you are a PHP developer, you can use the free PHP Quick Profiler (PQP) to help profiling and debugging your code. No more echoing vars, objects or queries in order to find performance mistakes. Using an automated tool to show you what is going on, you can save a lot of time and ensure your app is stable and fast. I read about PQP at WebAppers these days. They also have a screenshot (below) and a link for a demo.
If you want more options for profiling and debugging, I recommend Xdebug, which is a very powerful tool. We have been using it at Decadium for a long time. Some of the features include stack traces and function traces in error messages (with full parameter display, function/file name and line indications), information about memory allocation and protection for infinite recursions.
Xdebug is also free and has support for Windows and Linux.


